Key Considerations in Selecting a Business Retirement Plan
Business retirement plans are tax-deferred savings vehicles for owners and their staff.
We introduced readers to the complex world of employer-sponsored plans in Article 1 of this series.
This installment offers a decision-making framework for business owners.
Many retirement plans are available to business owners. The number of options can be overwhelming. Stringent regulations and recordkeeping requirements introduce an added layer of complexity. Fortunately, a systematic approach makes the selection process more manageable.
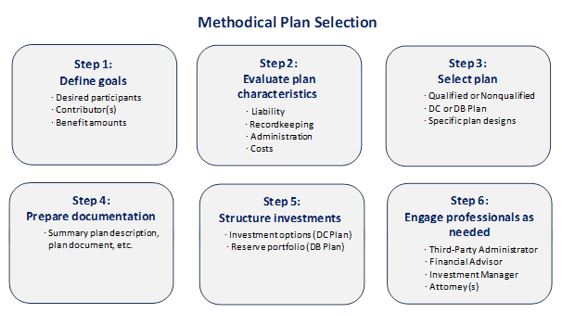
Plan adoption involves several interrelated steps. Goal setting is perhaps the most important action. This requires the company to decide who will participate, which party(ies) will contribute, and how much it would like to provide. By defining clear objectives, the owner can form a list of plan options. Next, businesses should review the responsibilities and costs associated with each option. Companies then choose a plan that best meets their criteria. Once a selection is made, owners prepare documentation, select investments, and implement the plan.
This article provides a decision-making framework for business owners. In reality, companies typically leverage outside professionals throughout the process. Investment professionals, third-party administrators, and attorneys all offer important services in this area. Regardless, an informed business owner is also a judicious one. A knowledgeable plan sponsor can mitigate costs and avoid headaches.
BaldwinClarke offers over fifty years of business planning experience. We proudly serve as a consultant and advisor for plans of various sizes. Our methodical process prioritizes education and objectivity. This fosters trust and allows business owners to focus on what they do best.


