The Analogy
If the title has a familiar ring to it, you may be recalling the admonition heard so often decades ago: “It’s 11 o’clock, do you know where your children are?” The safety of our children is always a concern. Where they are, where they are going and who they are with are important considerations, always. The safety of your portfolio obviously doesn’t rise to the level of the safety of your children, but it is important to know where it is, where it is going and who it is with. (By “who”, we do not mean your investment advisor, broker, or management firm as you will see below.)
Where is My Portfolio?
What return can I expect from it? How much risk exposure do I have? Is it efficient? What does efficient even mean?
An efficient worker is more productive than one who is not. An efficient process improves productivity. An efficient portfolio is also more productive as it improves return for every unit of risk assumed. An optimized efficient portfolio is expected to give you the most bang (return) for your buck (risk).
Your portfolio’s expected return, risk, and efficiency are all measurable. You can discover “Where it is.” (Read on.)
Where is My Portfolio Going?
Hopefully, it is on track to meet your objectives, but is it? What do you want your portfolio to do for you? Meet a retirement income objective as determined by a financial plan? Provide retirement income today and inflation-adjusted income for life? Create a legacy for your heirs? Buy a dream vacation home?
Whatever your objective, will your portfolio get you there? Is it growing fast enough? Are you taking on more risk than necessary to achieve your goals? Conversely, do you need to assume greater risk? Is the level of risk within your comfort zone?
What might the risks and returns be in five years, 10 years? The answers are available. (Read on.)
“What” is My Portfolio With?
A careful reader will see that we changed “who” for “what” in our somewhat tortured analogy.
What are the “Whats” that make up your portfolio? Surely some combination of stocks, or stock mutual funds, or Indexed ETF’s. Perhaps some bonds or bond funds. The company those “Whats” keep will be the primary drivers of your portfolio’s return and risk potential and its efficiency. These “Whats,” in investment speak, are Asset Classes.
Asset Classes
There are four major asset classes: stocks, bonds, alternatives, and cash. Each has subcategories. For example, stocks can include U.S. large and small company stocks and international stocks, among others. All told, there are approximately 20 asset classes available to invest in. How do you determine which asset classes are right for your portfolio and how much to invest in each?
The answer is an Asset Allocation Analysis, which in turn answers all the questions posed above. It is the heartbeat of BaldwinClarke’s [1] portfolio structuring.
Capital Market Assumptions and Asset Allocation Analysis
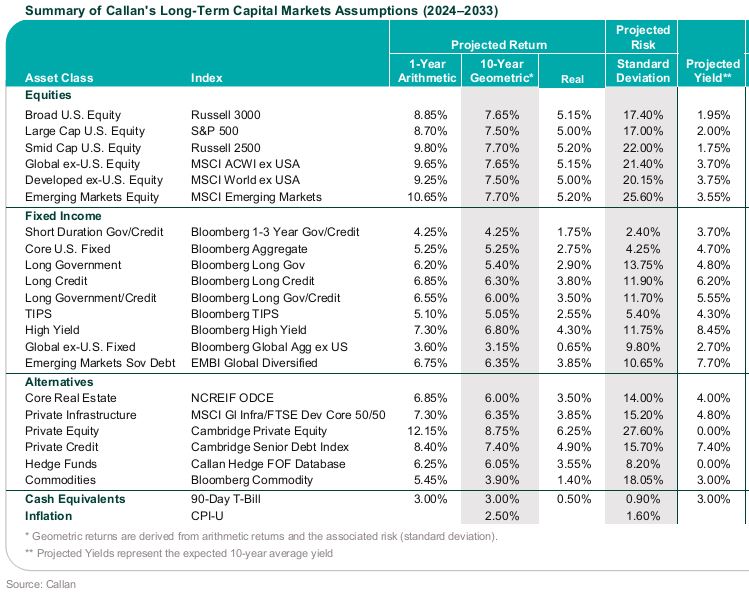
Capital Market Assumptions (“CMAs”) are the foundation of any asset allocation analysis. They are developed annually by virtually all major investment and consulting firms. BaldwinClarke has incorporated Callan [2] CMAs for the last 33 years. CMAs provide expected returns and risks over a 10-year time horizon for each asset class’s market index.
As importantly, Callan’s data includes a Correlation Table (not shown) illustrating how the return of each asset class correlates with the others. Highly correlated asset classes will tend to move together. The opposite is true for asset classes with low correlations.
BaldwinClarke uses these CMAs to create optimized efficient portfolios—the Holy Grail of portfolio design.
The CMAs assume that a recession will occur sometime in the 10-year period. Here are Callan’s 2024 CMAs:
The upward sloping line on the following Efficient Frontier chart plots the return/risk trade-off of a range of efficient portfolios based on expected market performance. They are deemed efficient because they generate the maximum expected return for their expected level of risk. They do this by taking optimal advantage of low correlations between the performance behavior of the different asset classes in each portfolio.
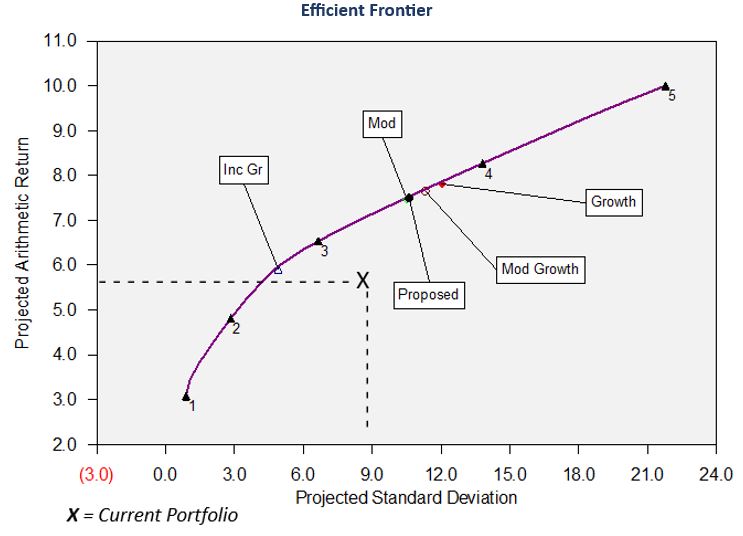
The “X” portfolio plots the expected risk and return of a hypothetical prospective client’s current asset class allocation. Their investment holdings are not a consideration except for determining what asset class bucket they fall into.
As you can readily see, if they are satisfied with their current expected return of slightly less than 6%, a new asset mix could provide the same return with about two thirds the risk. (The intersection of the horizontal dashed line with the Efficient Frontier curve.) Conversely, if they are comfortable with their current risk, they could move to a portfolio with an expected return of approximately 7%. (An extension of the vertical dashed line to the Efficient Frontier curve.)
Asset Allocation Mixes: The Analytics
Our software and 83 years of combined BaldwinClarke portfolio design experience come together to produce efficient portfolios. Here are the asset mixes and related metrics for the portfolios on the above Efficient Frontier curve. (For the mathematically curious, Mean Variance Optimization is the quantitative tool used to create this range of optimized efficient portfolios.)
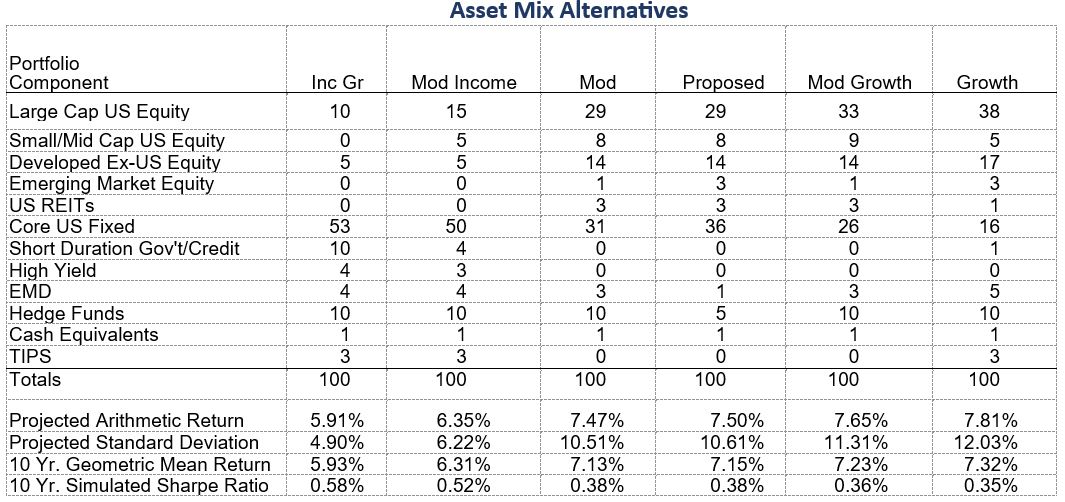
Each portfolio has its own asset class mix and the percentage of the portfolio allocated to them. The return/risk metrics are estimates for a 10-year holding period.
The Projected Arithmetic Return is the simple 10-year average of the projected annual returns of each portfolio. The Standard Deviation is the primary measure of risk. The higher the number the greater the expected volatility of the portfolio.
The 10-year Geometric Mean Return is the one to focus on. It reflects the probabilities of varying return streams. Think of it as the expected mean compounded annual return. The 10-year simulated Sharpe Ratio is a measure of risk adjusted returns. Positive Sharpe Ratios tell you that you’re rewarded for the risk taken. Low risk portfolios tend to have higher Sharpe Ratios as they have less risk.
Your portfolio’s metrics can be determined with this methodology. (“Where is my portfolio?”)
Putting Portfolio Metrics to Work: More of “Where is my portfolio?”
The following chart provides the range of projected rates of return for any one year for each of the portfolios. They are developed through 5000 computer simulations of possible one-year results.
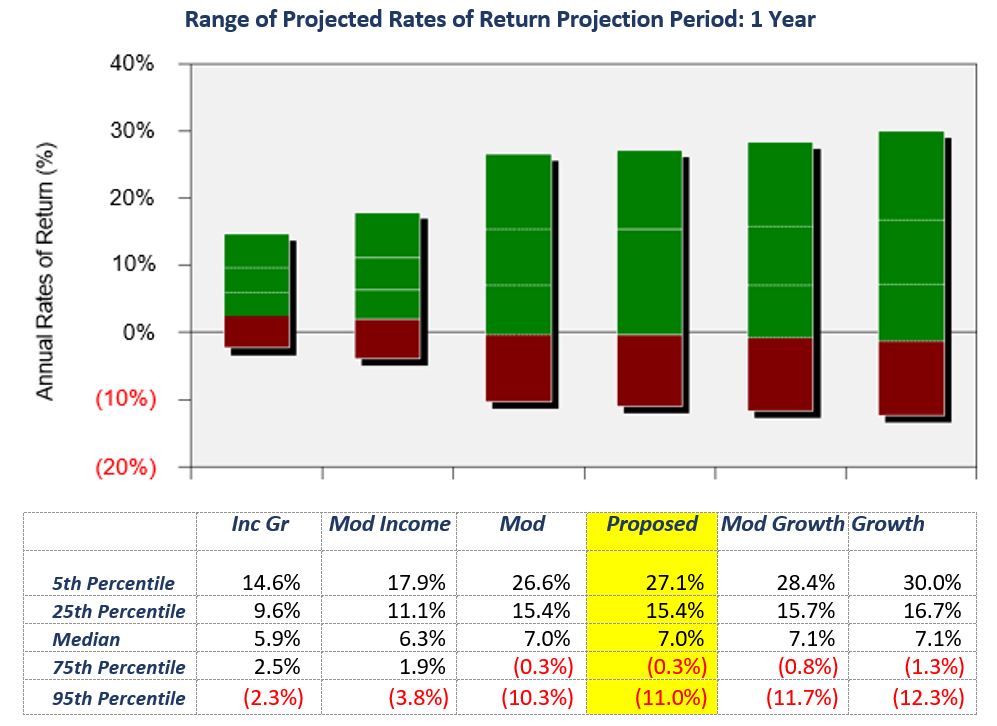
Let’s focus on the “Proposed” portfolio. The mid-point of the range of projected returns for any one year (the Median) is 7.0%. There is a 5% probability that the portfolio could return 27.1% or more (5th percentile) or lose 11.00% or more (95th percentile). Fifty percent of the expected returns will fall between 15.4% and -.3% , the 25th and 75th percentiles respectively.
Returns Over Time – “Where is my portfolio going?”
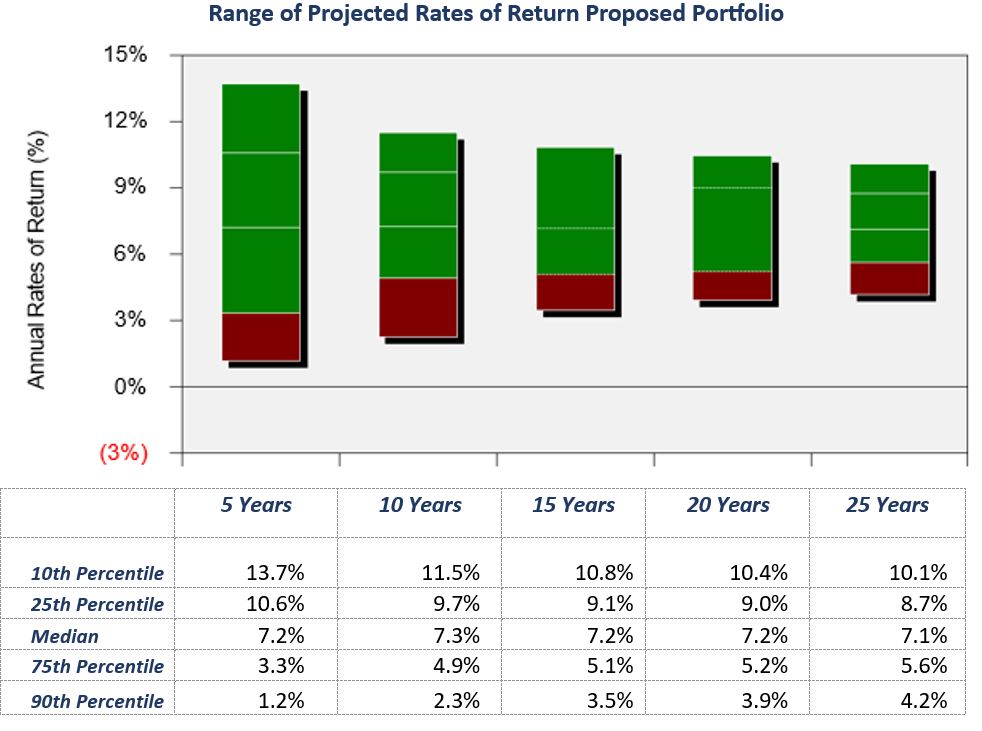
It should come as no surprise that the range of a portfolio’s returns will narrow over time. The very good and very poor years tend to average out. The chart below for the “Proposed” portfolio illustrates the point.
These returns range from the 10th percentile to the 90th percentile. Returns tend to fall in the middle quartiles over time. Note that the longer-term median return is slightly higher than the one-year median of 7%.
Meeting Objectives—More of “Where is my portfolio going?”
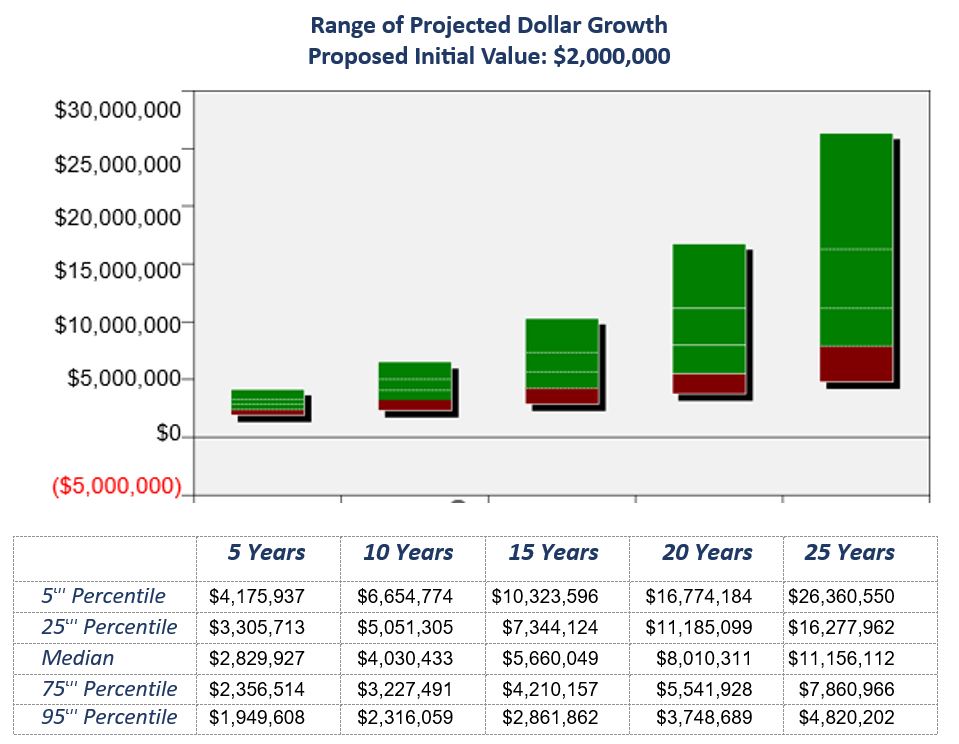
The above has focused on rates of return because they determine results. What you really want to know is, “How am I doing?”, “How many dollars will I have?” Let’s look at the proposed portfolio again, assuming a $2 million investment.
So Much More
This has been an introduction to how CMAs and sound asset allocation modeling can help you better understand your portfolio and how optimization might improve it. It is a best practices approach to asset class selection. This process is so much more robust than what we’ve covered here. For example, the above results are in nominal dollars, they can also be expressed in real (after inflation) dollar terms.
We can input your income requirement, other sources of income, expected future portfolio additions or withdrawals, whether annual or for special events, and provide expected financial results on a nominal and real basis. You can truly see where your portfolio can take you relative to where you want to go.
A Few Final Notes
Recall that this modeling process projects expected market-based results of a basket of asset classes. You or your advisor are left to determine what investment process to use, and what investments will populate each asset class. There is, we believe, a best practices approach to that as well, but that is another story for another day.
We do not suggest that we can predict the future. We can’t. What we can do is provide a reasonable range of possible future outcomes with a high degree of certainty. Results that are a meaningful planning tool. Callan has been back-testing these results over many 10-year periods and finds that outcomes fall within the range of expected results.
We are always happy to talk if you would like to explore our asset allocation process and approach to portfolio development.
Co-Founder & President
Baldwin & Clarke Advisory Services, LLC
[1] Wealth Management Services are offered through Baldwin & Clarke Advisory Services, LLC (BCAS). BCAS is a Registered Investment Advisor (RIA) with the United States Securities and Exchange Commission (SEC). BCAS’s Form CRS and Form ADV Part 2 are on our website www.baldwinclarke.com. Additional information about BCAS is available on the SEC’s website www.adviserinfo.sec.gov, using CRD #105666.
[2] Callan, founded in 1973, is one of the largest independently owned investment consulting firms in the U.S. with $4.6 trillion assets under advisement. The Callan Institute was established in 1980 and continues to lead the investment industry through its research and education.
#investments #portfolio #assetclass #capitalmarketassumptions #assetallocation #efficientfrontier


