A yield curve is a graphical representation used to show the yield on bonds (of equal credit quality) over a range of maturity periods.
It plots bond yields (vertical axis) against maturities (horizontal axis).
Generally, longer maturities have higher yields than shorter maturities as investors want a higher return when they are taking longer term risks. This yield curve is usually upward sloping and gradually flattens out as maturities get longer.
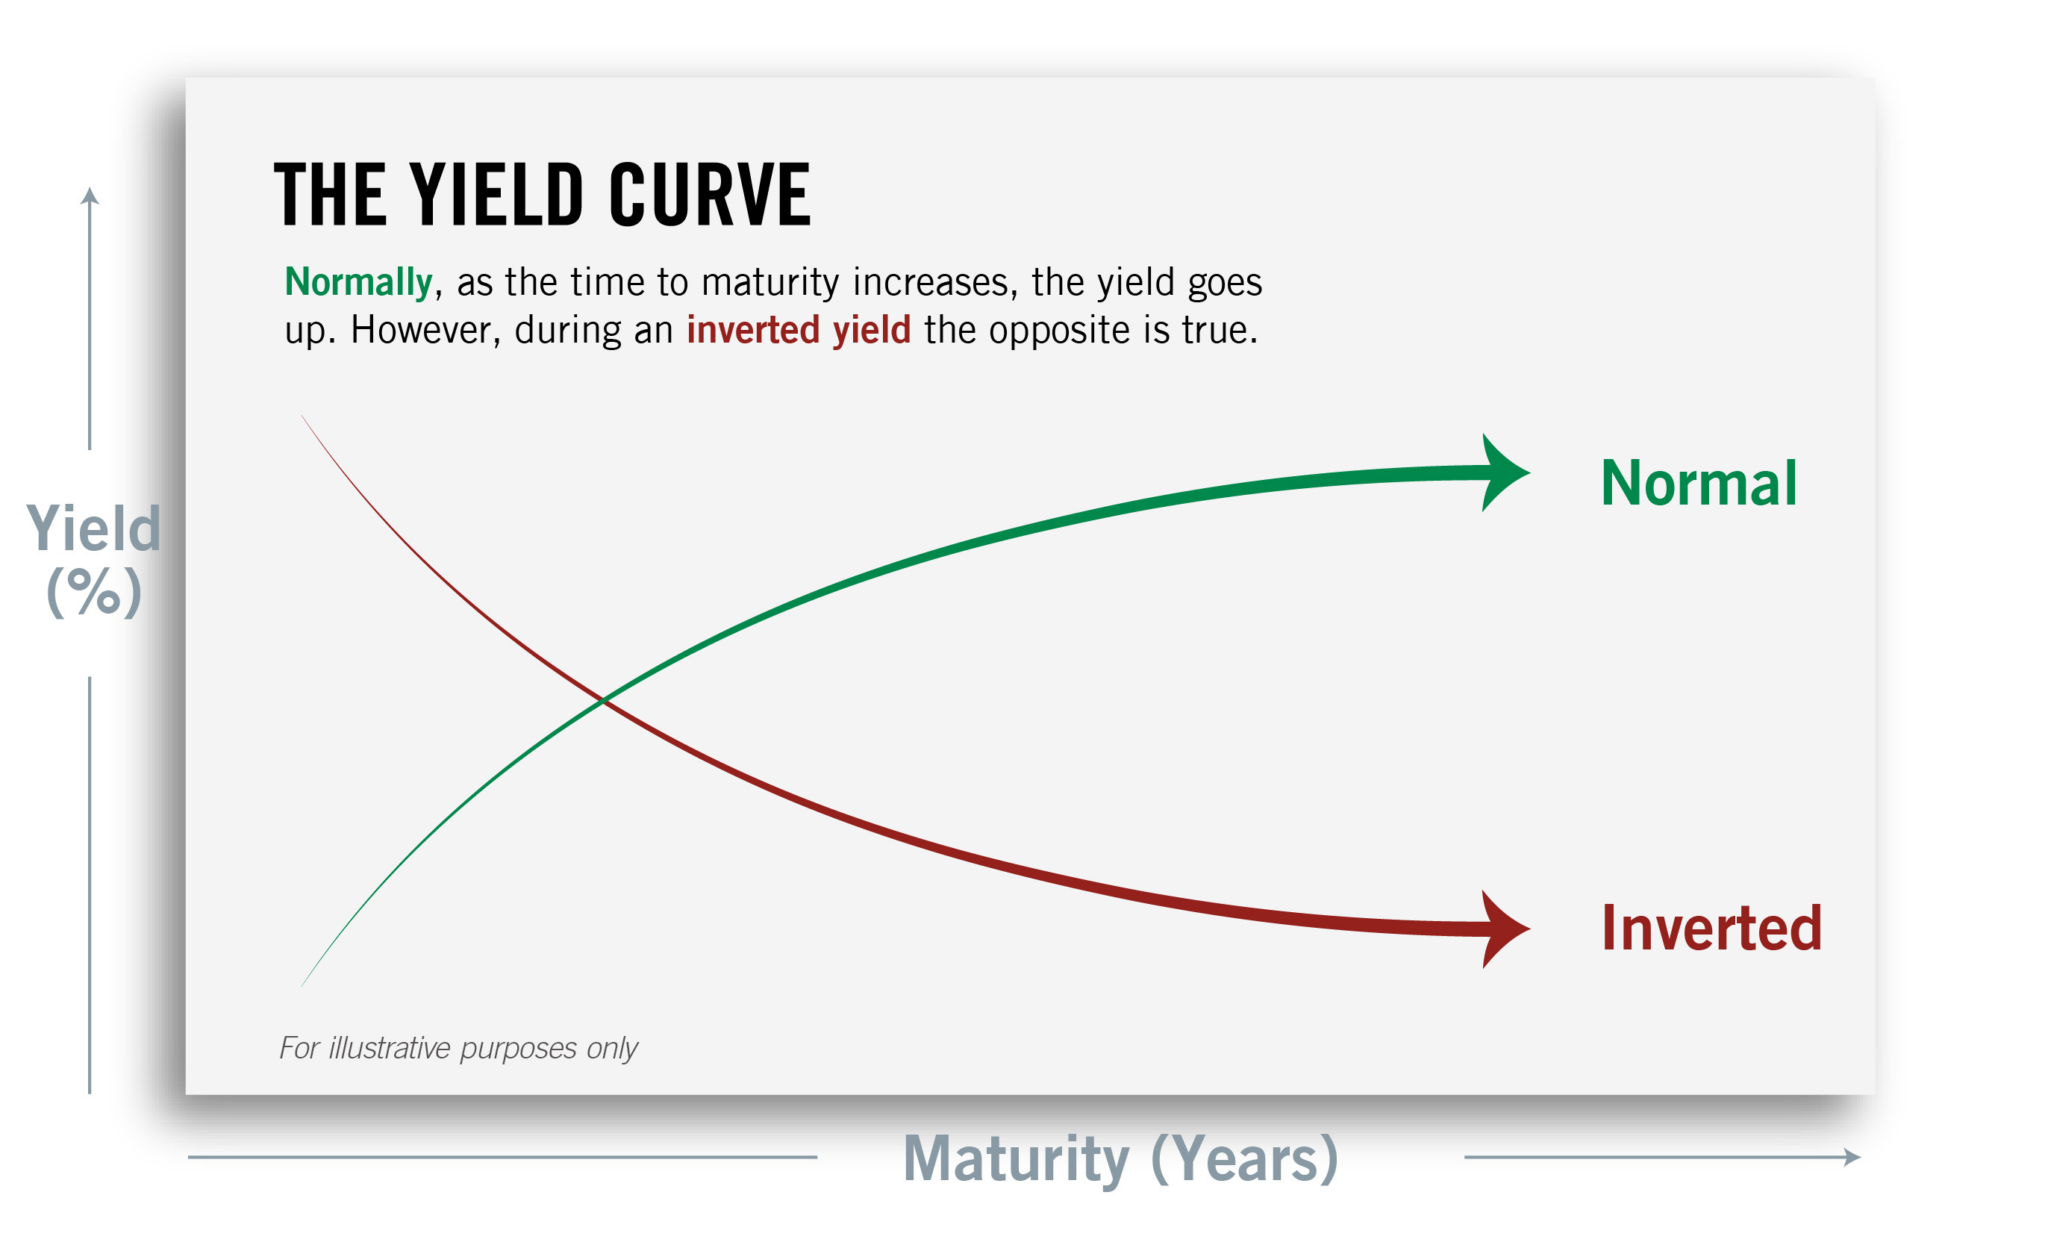
However, the yield curve may be inverted when longer maturities have a lower yield than shorter maturities.
This indicates that an anticipated decrease in long-term interest rates over time is expected. Historically, the inverted yield curve has proven to be a reliable indicator of a recession.
The most widely used bond yield curve is for U.S. Treasuries. Its slope and shape measure investors’ feelings about risk and the direction of the economy.
#finterms #yieldcurve #bonds #invertedyieldcurve #maturities #yields