

A turnaround after the March selloff as the beat goes on. The Nasdaq Composite and the S&P 500 had their strongest quarter since 2020. They, and the Dow Jones Industrial Average, reached new highs several times in Q2. The Dow closed the quarter with a new record high, its best first half since 2021. The primary drivers were AI mania, exceptionally strong earnings, particularly from the semi-conductor producers, and a resilient economy.
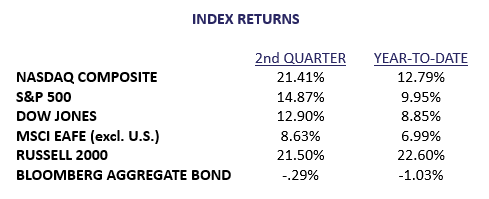
June saw a rotation to small caps and value stocks as investors pulled back from the high valuations of the tech and AI stocks. The S&P 500 and the Nasdaq Composite were down 1.32% and 3.22% respectively for the month, and down 5.38% and 6.22%, respectively, for the week ending June 26. Contributing factors:
- Continued investor concern about the potential payoff on the $7 trillion infrastructure investments AI companies are making, and who will be the winners in what Capital Group economist Darrell Spense has appropriately dubbed the “AI Arms Race”?
- The bond market pricing in two or three Fed rate hikes when just a few months ago there was hope for rate reductions.
- Profit taking.
As to the first point, AI companies have transformed from companies with low capital requirements to highly capital-intensive companies. They have borrowed heavily to finance data center build-out and are now issuing new stocks as well, moving from internal financing to public financing, adding to investor risk. According to Goldman Sachs, global year-to-date debt issuance by hyperscale companies reached $107 billion as of June 23rd exceeding 2025’s full year volume and dwarfing 2024’s total of less than $20 billion.
States that have welcomed data centers now have concerns about energy usage and water requirements. Virginia offered tax incentives and is now taxing energy usage.
It didn’t take long to see a recovery from the one week selloff. The tech and communication sectors were up .09% and 5% respectively in the first week of July. The S&P 500, the NASDAQ and the Dow were all up close to 2% for the week.
The June jobs report was weak with only 57,000 new jobs, half of what was expected, and downward adjustments of 74,000 to the strong reports of the previous two months. This news would usually pull markets down. But, combined with an improved inflation outlook (see below), it reduced expectations for Fed rate hikes, which fueled the market rally last week. Many economists now think we will see only one, or possibly no rate hikes this year.
On a macro level, inflation remained high, driven largely by higher energy prices. PCE (Personal Consumption Expenditures), the Fed’s preferred index, was up 4.1% year-over-year. CPI (Consumer Price Index) was up 4.2% year-over-year. There has been some inflation migration beyond the energy sector to the cost of other goods and services. These inflation numbers helped drive the market expectations for Fed rate hikes, as noted above.
Oil prices have since plummeted from $110 to $67 a barrel, which is less than the pre-Iran War level. If oil prices remain low, the result should be a drop in inflation as reduced energy costs work their way through the distribution chain. All good news for the economy and the markets. Much of the investment in AI infrastructure flows to small and mid-size companies, both domestic and in emerging market countries, which should help to further broaden stock returns.
Fixed income continues to have a role in diversified portfolios. Increased yields should provide portfolio income ranging from 4 to 4.5%, which makes up for some of the value decline caused by the yield increases. This sets up the opportunity for value gains when yields drop.
International stocks offer diversification even though their returns are likely to lag US performance. It’s useful to remember that they led the equity markets in 2025. The consensus view is that Europe will have slower GDP growth than the U.S. owing to higher energy costs.
Country selection can be as important to international portfolio managers as company selection. In the above table, the MSCI EAFE Index ex. U.S. performance lagged the U.S. markets. In June that index returned just .07%. The Japanese Nikkei index gained 4.67% in June. Interestingly, the two primary tactical allocation managers we have in many portfolios had most of their international positions in the Nikkei.
The general outlook for the economy is positive with expected modest GDP growth of 2%, well above recession levels. (Goldman has reduced its 12-month US recession risk from 25% to its long-term norm of 15%.) Earnings drive stock prices over the longer term. Second quarter earnings were strong. Expectations are that Q3 earnings will follow suit. US earnings growth is expected to be 23% in 2026 as opposed to 2025’s 13%. According to Ben Snieder, chief U.S. equity strategist in Goldman’s research company, earnings drove all of the S&P 500’s 21% return over the last 12 months. Unemployment continues to hold steady at 4.2%.
With all the caveats about everything that could possibly happen, we expect U.S. and international (especially emerging markets) stocks to continue their positive momentum, at least into the second quarter. However, S&P 500 index investors will have concentration risk as the top 10 largest market cap companies make up 40% of the index’s performance.
As for the fourth quarter, we expect the continuation of a positive economic environment and continued favorable corporate earnings, with inflation trending lower. This should maintain the upward market trend but for the mid-term elections. Mid-term pre-election periods are marked by increased volatility. The great unknown is investor sentiment after the election. Early post mid-term election returns are generally muted followed by a rally in the following year.
We are in an unprecedented bull market run. Stock prices are rising. Why? Because of the record flow of dollars into the market in pursuit of performance. But where is the money coming from? And why does it matter? I read an interesting and timely article by Lance Roberts of Real Investment Advice that answers these questions. (Lance Roberts, “Record Retail Inflows: Where Is All the Money Coming From?”, Advisor Perspectives, June 30, 2026.)
Here are Mr. Roberts’ key points:
Where is the money coming from?
- There is a record $7.92 trillion in money market funds as of June 17th, $3.09 trillion of which is held by retail investors who flocked into MM funds and away from equities when 5% returns were available with little or no risk. With subsequent falling yields, the onset of Iran peace talks and the strong May jobs report, the flow reversed. Dry powder chasing returns.
- A second source is the top 10% of households that own roughly $50 trillion of equities and mutual funds, about 87% of the total. (Federal Reserve, Financial Accounts of the United States (Z.1), household equity and mutual fund ownership by percentile group, as compiled by Citadel Securities/GMI, as of June 16, 2026.) That group also has the highest cash-as-a-share-of-assets level since 1990, nearly 8%. They are rotating into the market- melt-up.
- The third money source is the companies themselves. Buyback authorizations across the Russell 3000 companies hit a record $926 billion year-to-date through mid-June, with information technology accounting for 42% of it. In Mr. Roberts’ words: “Corporate America is the largest, most price-insensitive bidder in the market and it does not check the Bankrate survey before purchasing shares.”
- The bottom 50% of households are also participating. Their equity holdings are at a record $617 billion. That’s owing to employer and employee contributions to 401(k) plan target date and mutual funds. This continuous automatic source of new investment is obviously good for the market.
- Finally, one money source that Mr. Roberts says should make you cautious, is not money at all, but leverage. Leveraged ETF assets just hit a record $218 billion, two- thirds of it in tech and semiconductors. Borrowed money creates the leverage of 2x to 3x the index return. The problem is that it does the same in reverse when markets move down. This leverage could accelerate any market pullback.
- Options are another form of leverage. Retail options premium (the price you pay to buy or sell an option) ran close to $7 billion a day in June, an all-time high. There was a single day in June when four major types of financial derivatives contracts expired with a notational (theoretical underlaying asset value) of $8.3 trillion and had to be completely erased by settling in cash or rolling over into new futures contracts.
Why does it matter?
- Roberts says, “The record retail inflows are running on liquidity rather than fundamentals. When record cash balances, buybacks, and leverage all hit the bid at once, prices go up whether the underlying economy justifies it.” Note that this is an observation and not a suggestion that the current fundamentals do not support the run up. He goes on to recall Bob Farrell’s Rule #4 of his 10 Market Rules to Remember: “Exponentially rapidly rising or falling markets usually go farther than you think, but they don’t end by going sideways.” (Bob Farrell was Merrill Lynch chief market strategist from 1967 to 1992.)
- Through mid-June, plain index, active and bond ETFs received more than $1 trillion, a record. Add to that the $218 billion of leveraged ETFs. The ETFs are forced buying of the underlying securities and the concentration of those flows has been primarily in AI and related technology. He points out that semiconductors, a single sector, now make up 18.18% of the index. He says, “This is not breadth. That is a very large bet that a handful of chip names keep delivering, and it means a single disappointing print can bring the whole tape with it.”
- He believes we are in the late stage of a bull market. The signals are that 1.) cash hoarders have given in and are moving into risk assets and 2.) leverage hitting record highs. He thinks Bob Farrell’s Rule #9 applies: “When all the experts and forecasts agree—something else is going to happen.”
- Robert’s concludes with: “In the near term, the flow has the wind at its back. The first half of July is the strongest seasonal stretch for the S&P going back to 1928. It has been positive 68% of the time, and retail buying tends to surge in July. I’m not telling you to short this market. I’m telling you to understand what’s fueling it because fuel runs out.”
From our perspective, the takeaway is to continue with your non-concentrated diversified “all- weather” portfolio and to rebalance to target holdings percentages. Rebalancing isn’t market timing. It’s selling a little of what got expensive to buy something that didn’t.
Portfolios have benefitted from the huge cash inflow that raised stock prices, and when the tide reverses, perhaps because the Fed turns hawkish, that’s the part of the cycle where the careful investor gets paid to be careful.
Co-Founder & Financial Advisor
Baldwin & Clarke Advisory Services, LLC
#MarketVolatility #LongTermInvesting #EconomicOutlook #InvestorPerspective #MarketCommentary
For informational purposes only and is not investment, financial, legal, or tax advice. References to investments or strategies are not recommendations to buy, sell, or hold any security. You should consult your own financial, legal, tax, or investment professionals before making any decisions.